

이번 주는 SQL 고객분석과 미니 프로젝트를 했던 주였다.
했던 것을 복습하기 위해, Olist 데이터셋으로 고객 분석을 진행해보았다.
월별 재구매율 구하기
/****월별 재구매율****/


with
cte_customer
as (
	select distinct c.customer_unique_id as cid, date_trunc('month', o.order_purchase_timestamp) as date,
		   op.payment_value
	from orders o
	left join order_items oi ON o.order_id  = oi.order_id
	left join customers c on c.customer_id = o.customer_id
	left join order_payments op on op.order_id = o.order_id
	),
-- 셀프조인
cte_join
as (
	select c1.cid, c1.date, c2.date as next_date
	from cte_customer c1
	left join cte_customer c2 on c1.cid = c2.cid
	and c1.date  + '1 mon' = c2.date
	)
select to_char(date, 'YYYY-mm') as datemonth, count(date) as 전체구매자수 ,
	   count(next_date) as 다음달구매자수, round(count(next_date) /count(date)::numeric * 100,2)||'%' as 재구매율
from cte_join
group by 1
order by 1;
참고로 이 데이터셋의 월별 재구매율은 극악이다..

카테고리별 분기별 재구매율
전체 재구매율이 너무 안좋아서 그럼 카테고리별로는 좀 다를지 확인해보았다.
월별로 확인해봤더니 너무 안나와서 분기별로 확인해봄.
/****카테고리별 분기별 재구매율****/


with
cte_customer
as (
	select distinct c.customer_unique_id as cid, date_trunc('quarter', o.order_purchase_timestamp) as date,
		    pcnt.product_category_name_english  as catename
	from orders o
	left join order_items oi ON o.order_id  = oi.order_id
	left join customers c on c.customer_id = o.customer_id
	left join order_payments op on op.order_id = o.order_id
	left join products p on p.product_id = oi.product_id
	left join product_category_name_translation pcnt on pcnt.product_category_name = p.product_category_name
	),
-- 셀프 조인
cte_join
as (
	select c1.catename, c1.date as date, c2.date as next_date
	from cte_customer c1
	left join cte_customer c2 on c1.cid = c2.cid
	and c1.catename = c2.catename
	and c1.date + '3 mons' = c2.date
	)
-- 분기별 재구매 숫자 세기
select  to_char(date, 'YYYY-quarter') as quarter, catename, count(date) as 해당분기구매자수, count(next_date) as 다음분기재구매수 , count(next_date)/count(date)::numeric * 100 as 재구매율
from cte_join
group by 1,2
order by 5 desc
재구매율 순으로 정렬했을 때, 몇 가지 카테고리가 계속 눈에 보이는 것을 알 수 있었다.
Decil 분석
매출을 기준으로 10등분으로 나누어 분석하는 방법
/************ decil 분석 *************/
with
cte_customer
as (
	select distinct c.customer_unique_id as cid, date_trunc('month', o.order_purchase_timestamp) as date,
		   op.payment_value as amount
	from orders o
	left join order_items oi ON o.order_id  = oi.order_id
	left join customers c on c.customer_id = o.customer_id
	left join order_payments op on op.order_id = o.order_id
	),
-- 10등분하기
cte_customer_10
as (
	select cid, sum(amount) as amount,
		case when sum(amount) is not null then ntile(10) over(order by sum(amount) desc)
		else 10 end as decil
	from cte_customer
	group by 1
	order by 3
	),
-- 구성비 구하기
cte_customer_per
as (
	select decil, sum(amount) as amount
	from cte_customer_10
	group by 1
	),
-- 누적구성비 구하기
cte_customer_cum
as (
	select *, sum(amount) over () as 총매출, amount/sum(amount) over() as 구성비
	from cte_customer_per
	)
select *, sum(구성비) over(order by decil)* 100 as 누적구성비
from cte_customer_cum
ABC 분석
/********* ABC분석 ************/


with
cte_customer
as (
	select distinct c.customer_unique_id as cid, date_trunc('month', o.order_purchase_timestamp) as date,
		   op.payment_value as amount
	from orders o
	left join order_items oi ON o.order_id  = oi.order_id
	left join customers c on c.customer_id = o.customer_id
	left join order_payments op on op.order_id = o.order_id
	),
-- 그룹바이
cte_group
as (
	select cid, sum(amount) as amount
	from cte_customer
	group by 1
	order by 2 desc
	),
-- 구성비
cte_percent
as (
	select *, sum(amount) over() as 총매출, amount/sum(amount) over() as 구성비
	from cte_group
	order by amount desc
	),
cte_cum
as (
	select *, sum(구성비) over(order by amount desc, cid) as 누적구성비
	from cte_percent
	order by 2 desc
	)
select *,
	case when 누적구성비 <= 0.7 then 'A'
		 when 누적구성비 <= 0.9 then 'B'
	else 'C' end as grade
from cte_cum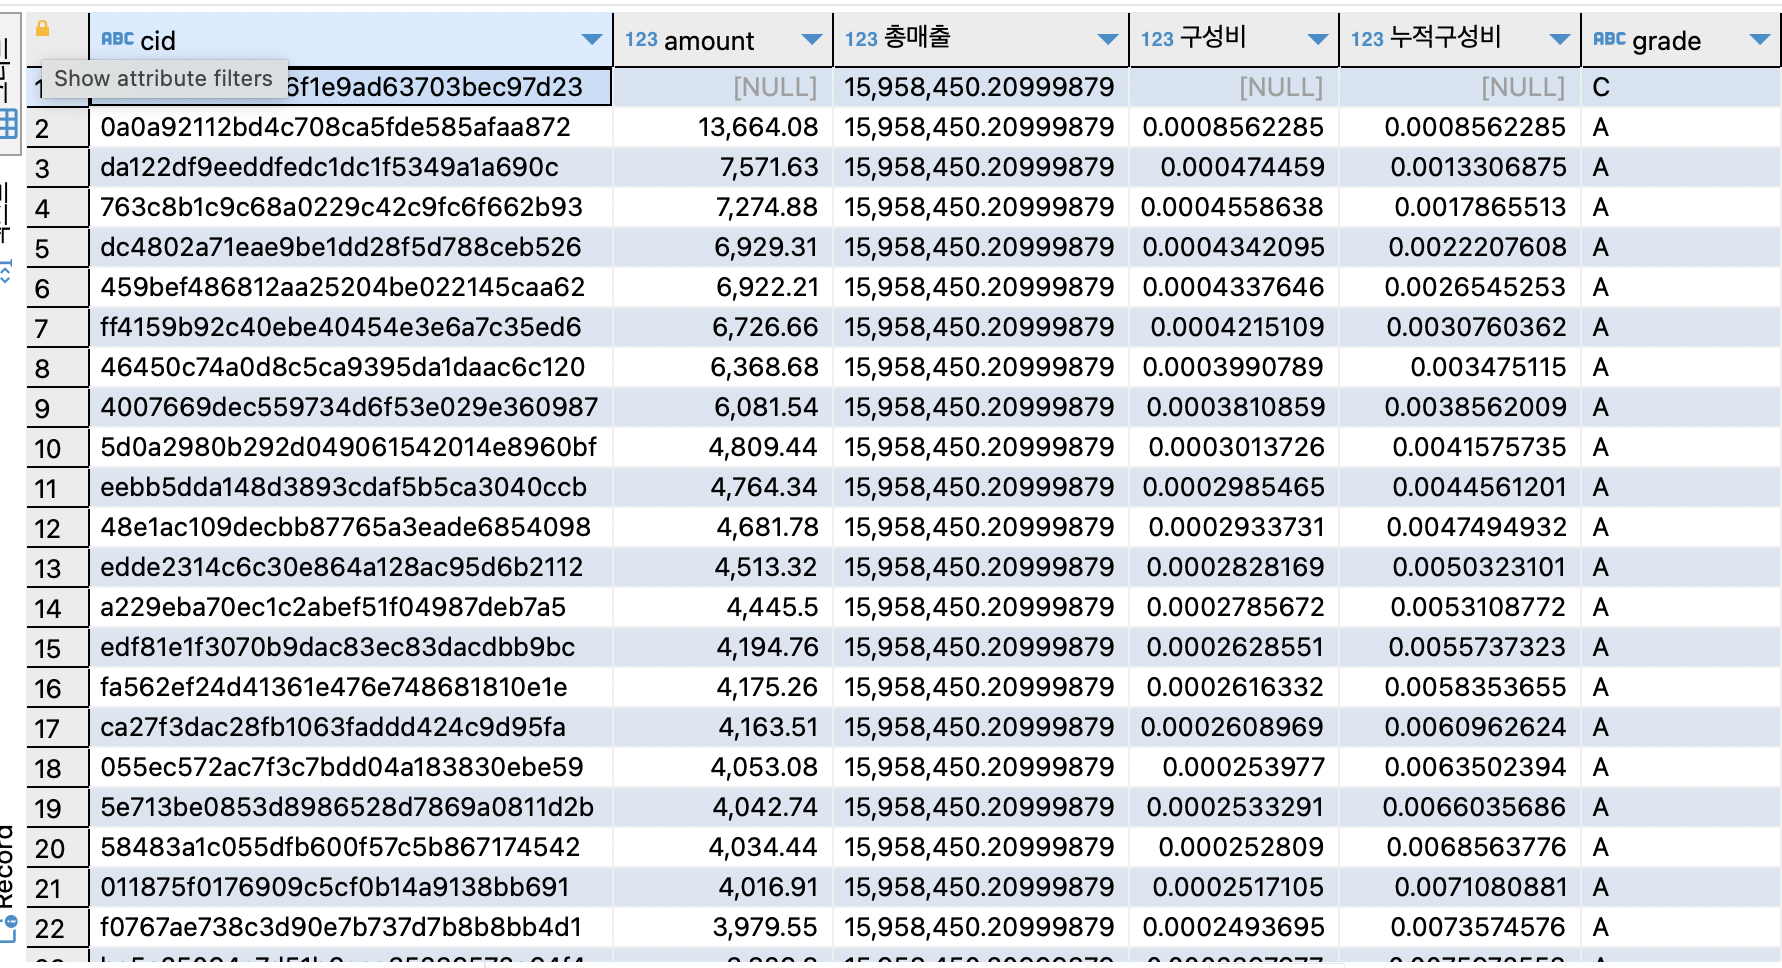
SQL 미니 프로젝트 : 판매자 분석
우리 조는 판매자 분석을 주제로 잡아, RFM 모델을 적용하여 Good Seller와 Bad Sller, 그리고 과거 우수 Seller를 분류해보았다.
1. 셀러별 RFM 구하기
Recency : 기준일 - 셀러별 최종 판매일
Frequency : 셀러별 총 주문건수 / 셀러별 판매기간
Monetary : 셀러별 총 매출
Frequecny 같은 경우 그냥 총 주문건수로 하면 판매를 일찍 시작한 셀러들에게 점수가 몰리는 것을 방지하기 위해 셀러별 총 판매기간으로 나누어 주어 일 평균 몇개를 판매하고 있는지의 지표로 평가하였다.
 with first_table as
(
select s.seller_id,
	 o.order_id, o.order_status, date_trunc('day',o.order_purchase_timestamp) as date,
	 date_trunc('day',o.order_delivered_customer_date) as deliver_day,
	 op.payment_value,
	 pcnt.product_category_name_english,p.product_id,
	 r.review_score
from sellers s inner join order_items oi on oi.seller_id = s.seller_id
			 inner join order_payments op on op.order_id = oi.order_id
			 inner join orders o on oi.order_id = o.order_id
			 left join reviews r on r.order_id = o.order_id
			 inner join products p on p.product_id = oi.product_id
			 inner join product_category_name_translation pcnt on pcnt.product_category_name = p.product_category_name
where pcnt.product_category_name_english = 'health_beauty'
),
-- 셀러별 판매시작날짜, 최종판매날짜, 주문건수, 매출액
cte_seller
as (
	select seller_id,
		   min(date) as 판매시작날짜,
		   max(date) as 최종판매날짜,
		   count(distinct order_id) as 주문건수, sum(payment_value) as 매출액,
		   date_part('day', max(date)- min(date)) as 판매기간
	from first_table
	group by 1
	having date_part('day', max(date)- min(date)) <> 0
	),
-- 기준일 구하기
cte_today
as (
	select *, max(최종판매날짜) over() as 기준일
	from cte_seller
	),
cte_rfm
as (
	select seller_id,
		   date_part('day', 기준일 - 최종판매날짜) as recency,
		   주문건수/판매기간::numeric as frequency,
		   매출액 as monetary
	from cte_today
	),
--rfm 기준 구하기
cte_standard
as (
	select seller_id,
		   recency, ntile(5) over(order by recency desc),
		   frequency, ntile(5) over(order by frequency),
		   monetary, ntile(5) over(order by monetary)
	from cte_rfm
	order by 6 desc
	),
-- 구한 기준으로 등급 나누기 (f, m 같은 경우 구간이 겹치지 않아 그대로 진행)
cte_score
as (
	select seller_id,
		   recency,
		   case when recency >= 185 then 1
		   	    when recency >= 68 then 2
		   	    when recency >= 24 then 3
		   	    when recency >= 10 then 4
		   else 5 end as r,
		   frequency, ntile(5) over(order by frequency) as f,
		   monetary, ntile(5) over(order by monetary) as m
	from cte_rfm
	order by 2 desc
	),
-- 셀러별 rfm 최종
cte_rfm_fin
as (
	select *, r+f+m as score
	from cte_score
	order by 8 desc
	),
-- 셀러별 매출비 누계 구하려고 매출액 가져옴
cte_rfm_monetary
as (
	select score, sum(monetary) as 매출액
	from cte_rfm_fin
	group by 1
	order by 1 desc
	),
-- 셀러별 매출비 구하기
cte_rfm_sales
as (
	select score, 매출액, sum(매출액) over() as 총매출액,  매출액/ sum(매출액) over()::numeric * 100 as 매출비
	from cte_rfm_monetary
	),
-- 셀러별 매출비 누계 최종
cte_seller_cum
as (
	select *, sum(매출비) over(order by score desc) as 매출비누계
	from cte_rfm_sales
	),
-- 스코어별 매출비 구하려고 그룹바이
cte_score_monetary
as (
	select score, sum(monetary) as 매출액
	from cte_rfm_fin
	group by 1
	order by 1
	),
-- 스코어별 매출비 구하기
cte_score_monetary_percentage
as (
	select *, sum(매출액) over() as 총매출액, 매출액/sum(매출액) over() * 100 as 매출비
	from cte_score_monetary
	),
-- 스코어별 매출비 최종
cte_score_monetary_cum
as (
	select *, sum(매출비) over(order by score) as 매출비누계
	from cte_score_monetary_percentage
	)
-- 셀러별 rfm 최종 : cte_rfm_fin
-- 셀러별 매출비 누계 최종 : 	cte_seller_cum
-- 스코어별 매출비 최종  : cte_score_monetary_cum
select *
from cte_rfm_fin;
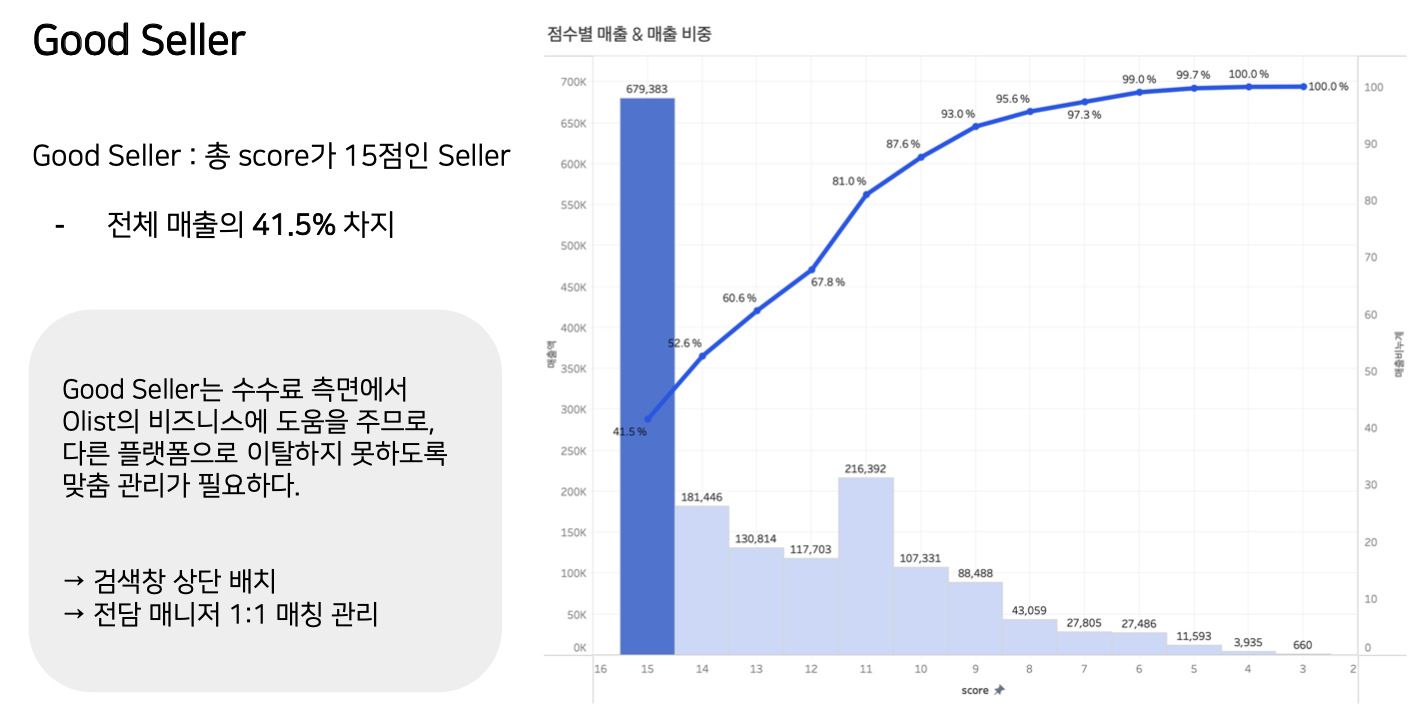
2. Good Seller와 Bad Seller
Good Seller : 총점이 만점 15점인 셀러들
Bad Seller : 스코어가 하위 25% 셀러들

3. 과거 Good Seller
Frequency Monetary가 둘다 최고점인 5점 만점이나, Recency가 중앙값(3) 이하인 셀러들
4. 등급별 분석 결과 & 결론
Good Seller
과거 Good Seller

Bad Seller

피드백
1. 장표가 난잡하다.
사실 급하게 만드느라 내가 봐도 발표자료를 보는 제 3자의 관점을 고려하지 못했던 것 같다. 설명이 없더라도 이해할 수 있도록 깔끔하게 만들어야 하는데 한 장에 때려 넣느라 복잡한 피피티가 탄생했다 ㅠㅠ
2 목적과 결론이 부실하다. ㅠ
목적 부분을 제대로 정의하지 않았고, 목적에 강조가 안되어 있었고 결론이 분석이랑 같이 들어가게 되면서 총 결론을 한 번더 강조해주지 못했다. 그래서 보는 이로 하여금 결론이 뭐지 하는 생각이 들게 만들었던 것 같다.
앞으로
우선 강사님 피드백을 들으면서 너무나 다 맞는 말이어서.. 반성하는 시간을 가지게 되었다.
청중을 고려하지 않은 피피티였고 부실했다. 너무 많은 분석을 하는 것 말고 흐름대로 목적 과정 결론 이 명확했으면 정말 좋았을 것 같다.
이번 주에 최종 평가 시험도 치뤘기 때문에, 남은 것은 해커톤 하나이다..!!!
5일동안 정말 힘들겠지만 마지막까지 노력해서 후회하지 않는 결과를 냈으면 좋겠다.
그동안 정말 배운것도 많았고 여러 다각도의 관점에서 분석해보면서
그간 내가 알고 있던 것 말고도 다양한 분석방법론이 있다는 걸 알게 되었다.
'유데미 스타터스' 카테고리의 다른 글
| 유데미 스타터스 취업 부트캠프 4기 - 데이터분석/시각화(태블로) 10주차 학습일지 (0) | 2023.04.16 |
|---|---|
| 유데미 스타터스 취업 부트캠프 4기 - 데이터분석/시각화(태블로) 9주차 학습일지 (0) | 2023.04.09 |
| 유데미 스타터스 취업 부트캠프 4기 - 데이터분석/시각화(태블로) 8주차 학습일지 (0) | 2023.04.02 |
| 유데미 스타터스 취업 부트캠프 4기 - 데이터분석/시각화(태블로) 7주차 학습일지 (1) | 2023.03.26 |
| 유데미 스타터스 취업 부트캠프 4기 - 데이터분석/시각화(태블로) 6주차 학습일지 (0) | 2023.03.19 |